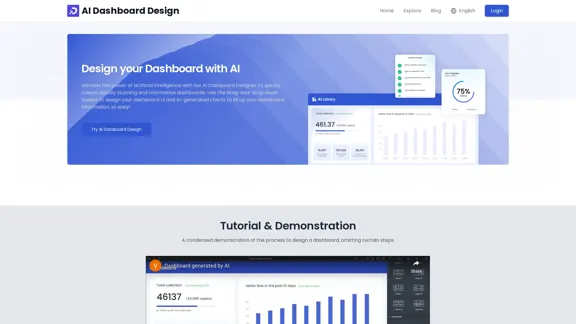
La conception de tableau de bord AI permet aux utilisateurs de créer rapidement des tableaux de bord visuellement attrayants et informatifs en utilisant l'intelligence artificielle. La plateforme dispose d'un constructeur visuel par glisser-déposer qui simplifie le processus de conception de tableau de bord, permettant aux utilisateurs d'incorporer facilement des graphiques générés par l'IA et divers composants.
Conception de tableau de bord avec l'IA
La conception de tableau de bord est une plateforme pour créer votre tableau de bord ou databoard avec l'IA et le créateur de graphiques.
Introduction
Fonctionnalité
-
Constructeur Visuel par Glisser-Déposer
Les utilisateurs peuvent facilement concevoir leur interface de tableau de bord en faisant glisser et en déposant des éléments, rendant le processus intuitif et convivial.
-
Graphiques Générés par l'IA
La plateforme propose des outils alimentés par l'IA pour créer divers types de graphiques, y compris des graphiques en secteurs, des graphiques linéaires, des graphiques à barres, et plus encore, améliorant les capacités de visualisation des données.
-
Modèles Personnalisables
Les utilisateurs peuvent choisir parmi une variété de modèles de tableau de bord préconçus et les personnaliser selon leurs besoins, offrant ainsi une flexibilité dans la conception.
-
Informations en Temps Réel
Les composants du tableau de bord sont conçus pour offrir des informations en temps réel, permettant aux utilisateurs de surveiller efficacement les indicateurs de performance clés.
-
Visualisation de l'Architecture des Données
L'outil aide les professionnels à visualiser l'architecture des données, facilitant l'identification des motifs et l'optimisation des algorithmes.
-
Section FAQ Complète
La plateforme comprend une section FAQ détaillée pour aider les utilisateurs à naviguer dans le processus de conception de tableau de bord et à résoudre les problèmes courants.
Comment utiliser ?
-
Choisir un Agencement
Accédez à la section "Agencement" pour choisir parmi divers modèles préconçus.
-
Personnaliser les Thèmes
Utilisez la section "Style" pour personnaliser votre tableau de bord avec différents thèmes et schémas de couleurs.
-
Ajouter des Composants
Cliquez sur le bloc souhaité pour ajouter des composants comme des graphiques ou des tableaux, et personnalisez-les selon vos besoins.
-
Utiliser la Boîte de Saisie IA
Simplifiez la saisie de données en tapant des requêtes en langage naturel, permettant à l'IA de générer des visualisations correspondantes.
-
Ajuster l'Apparence des Graphiques
Personnalisez les propriétés de chaque graphique, y compris les couleurs et les étiquettes, pour les aligner avec le design de votre tableau de bord.
FAQ
Comment choisir un agencement pour mon tableau de bord ?
Pour sélectionner un agencement, accédez à la section "Agencement" dans le constructeur de tableau de bord, où vous pouvez choisir parmi divers modèles préconçus.
Puis-je changer le style ou le thème de mon tableau de bord ?
Oui, vous pouvez personnaliser l'apparence de votre tableau de bord dans la section "Style" en sélectionnant différents thèmes et schémas de couleurs.
Quels types de graphiques et de diagrammes sont disponibles dans la conception de tableau de bord ?
Le constructeur de tableau de bord propose une large gamme de types de graphiques, y compris des graphiques linéaires, des graphiques à barres, des graphiques en secteurs, et plus encore, vous permettant de choisir la meilleure représentation pour vos données.
Comment fonctionne la boîte de saisie IA pour générer des tableaux statistiques ?
La boîte de saisie IA permet aux utilisateurs de taper des données ou des requêtes en langage naturel, que le moteur IA analyse pour générer des tableaux et graphiques statistiques correspondants.
Puis-je personnaliser l'apparence des graphiques et des données dans mon tableau de bord ?
Oui, le constructeur de tableau de bord permet une personnalisation extensive des apparences des graphiques, garantissant que les visualisations sont à la fois informatives et esthétiquement plaisantes.
Prix
- Essai Gratuit : Accès limité dans le temps
- Plan de Base : 9,99 $/mois
- Plan Standard : 19,99 $/mois
- Plan Professionnel : 49,99 $/mois
Le prix est donné à titre indicatif, veuillez vous référer aux données officielles les plus récentes pour des informations précises.
Évaluation
-
L'outil de conception de tableau de bord AI excelle à fournir une interface conviviale qui simplifie le processus de création de tableau de bord, le rendant accessible aux utilisateurs de différents niveaux d'expertise.
-
La variété de modèles personnalisables et de graphiques générés par l'IA améliore la fonctionnalité globale, permettant une visualisation efficace des données.
-
Cependant, certains utilisateurs peuvent trouver la courbe d'apprentissage initiale raide, en particulier lors de la navigation dans les fonctionnalités avancées.
-
La structure tarifaire pourrait être plus transparente, car les utilisateurs peuvent avoir besoin de plus d'informations sur les différences entre les plans pour prendre des décisions éclairées.
-
Dans l'ensemble, la conception de tableau de bord AI est un outil puissant pour créer des tableaux de bord, mais des améliorations dans l'orientation des utilisateurs et la clarté des prix pourraient améliorer l'expérience utilisateur.
Dernières informations sur le trafic
Visites mensuelles
0
Taux de rebond
0.00%
Pages par visite
0.00
Temps sur le site(s)
0.00
Classement mondial
-
Classement par pays
-
Visites récentes
Sources de trafic
- Médias sociaux:0.00%
- Références payées:0.00%
- Email:0.00%
- Références:0.00%
- Moteurs de recherche:0.00%
- Direct:0.00%
Sites web connexes
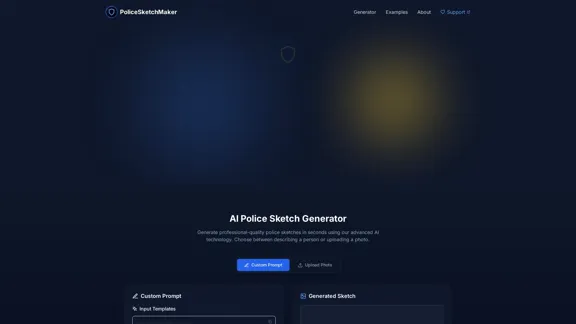
PoliceSketchMaker - Générer un croquis de police AI en ligne
PoliceSketchMaker - Générer un croquis de police AI en ligneDécrivez un suspect et générez instantanément un croquis de police AI. Essayez notre générateur de croquis réaliste alimenté par une IA de pointe.
347
Créateur de Logo Gratuit | Concevez Votre Propre Logo | Wix.com
Créateur de Logo Gratuit | Concevez Votre Propre Logo | Wix.comCréez un logo avec notre créateur de logo gratuit. Répondez simplement à quelques questions sur votre marque, et laissez notre générateur de logo IA créer un logo en ligne spécialement pour vous.
36.46 M
Générateur de Sites Web IA pour Créer des Designs de Sites Web (CSS/HTML) - MyCleverAI
Générateur de Sites Web IA pour Créer des Designs de Sites Web (CSS/HTML) - MyCleverAIMyCleverAI est un constructeur de sites web basé sur l'IA pour générer des designs de sites web. Générez des pages web entières, des éléments, des designs d'e-mails et plus encore à partir de texte ou de dessin avec notre générateur de design web alimenté par l'IA.
55.14 K

Meme PFP et PFP pour toutes les occasions - Meme PFP
Meme PFP et PFP pour toutes les occasions - Meme PFPPersonnalisez votre profil en ligne avec des milliers de PFP gratuits pour Discord, TikTok, Fortnite et plus encore
56.97 K

Générateur de photo de profil IA - Transformez des selfies en photos professionnelles.
Générateur de photo de profil IA - Transformez des selfies en photos professionnelles.Transformez vos selfies en photos de profil professionnelles avec notre générateur de photos de profil AI. Établissez la confiance et la crédibilité. Faites une première impression percutante.
0

Faites devenir votre influenceur IA viral avec les outils Pykaso AI. Créez et monétisez des personnages IA cohérents à partir d'images IA, de vidéos IA, d'upscalers IA et d'échanges de visages vidéo.
361.66 K
