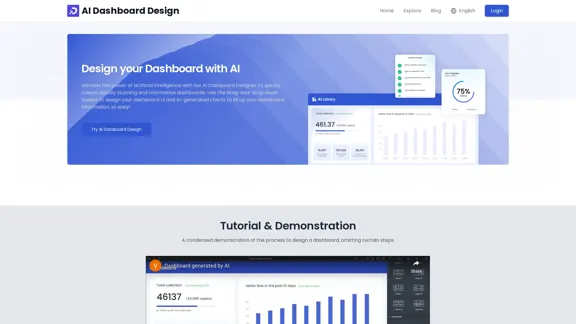
AI Dashboard Design enables users to create visually appealing and informative dashboards quickly using artificial intelligence. The platform features a drag-and-drop visual builder that simplifies the dashboard design process, allowing users to incorporate AI-generated charts and various components effortlessly.
AI-Driven Dashboard Design
Dashboard Design is a platform to create your dashboard or databoard using AI and Graph Maker.
Introduction
Feature
-
Drag-and-Drop Visual Builder
Users can easily design their dashboard interface by dragging and dropping elements, making the process intuitive and user-friendly.
-
AI-Generated Charts
The platform offers AI-powered tools to create various types of charts, including pie charts, line charts, bar charts, and more, enhancing data visualization capabilities.
-
Customizable Templates
Users can select from a variety of pre-designed dashboard templates and customize them according to their needs, providing flexibility in design.
-
Real-Time Insights
Dashboard components are designed to offer real-time insights, enabling users to monitor key performance indicators effectively.
-
Data Architecture Visualization
The tool helps professionals visualize data architecture, aiding in pattern identification and optimization of algorithms.
-
Comprehensive FAQ Section
The platform includes a detailed FAQ section to assist users in navigating the dashboard design process and troubleshooting common issues.
How to Use?
-
Choose a Layout
Navigate to the "Layout" section to select from various pre-designed templates.
-
Customize Themes
Use the "Style" section to personalize your dashboard with different themes and color schemes.
-
Add Components
Click on the desired block to add components like charts or tables, and customize them as needed.
-
Utilize AI Input Box
Simplify data entry by typing in natural language queries, allowing the AI to generate corresponding visualizations.
-
Adjust Chart Appearance
Customize the properties of each chart, including colors and labels, to align with your dashboard's design.
FAQ
How do I choose a layout for my dashboard?
To select a layout, navigate to the "Layout" section in the Dashboard Builder, where you can choose from various pre-designed templates.
Can I change the style or theme of my dashboard?
Yes, you can customize the look and feel of your dashboard in the "Style" section by selecting different themes and color schemes.
What types of charts and graphs are available in the Dashboard Design?
The Dashboard Builder offers a wide range of chart types, including line charts, bar charts, pie charts, and more, allowing you to select the best representation for your data.
How does the AI input box work for generating statistical tables?
The AI input box allows users to type in data or queries in natural language, which the AI engine parses to generate corresponding statistical tables and charts.
Can I customize the appearance of the charts and data in my dashboard?
Yes, the Dashboard Builder allows for extensive customization of chart appearances, ensuring that visualizations are both informative and aesthetically pleasing.
Price
- Free Trial: Limited time access
- Basic Plan: $9.99/month
- Standard Plan: $19.99/month
- Professional Plan: $49.99/month
The price is for reference only, please refer to the latest official data for actual information.
Evaluation
-
The AI Dashboard Design tool excels in providing a user-friendly interface that simplifies the dashboard creation process, making it accessible for users with varying levels of expertise.
-
The variety of customizable templates and AI-generated charts enhances the overall functionality, allowing for effective data visualization.
-
However, some users may find the initial learning curve steep, particularly when navigating advanced features.
-
The pricing structure could be more transparent, as users may require more information on the differences between plans to make informed decisions.
-
Overall, AI Dashboard Design is a powerful tool for creating dashboards, but improvements in user guidance and pricing clarity could enhance the user experience.
Latest Traffic Insights
Monthly Visits
0
Bounce Rate
0.00%
Pages Per Visit
0.00
Time on Site(s)
0.00
Global Rank
-
Country Rank
-
Recent Visits
Traffic Sources
- Social Media:0.00%
- Paid Referrals:0.00%
- Email:0.00%
- Referrals:0.00%
- Search Engines:0.00%
- Direct:0.00%
Related Websites

FaceRate.ai: Face Attractiveness Test & Detailed Face Analysis Tool
FaceRate.ai: Face Attractiveness Test & Detailed Face Analysis ToolFaceRate.ai offers a face attractiveness test, facial analysis, and golden ratio face tests. Get an in-depth evaluation of your facial features and artistic portraits.
64.78 K

Create stunning AI-generated photos and posters with your likeness. NewHero's AI photography tool allows you to shape your story quickly and affordably.
1.64 K
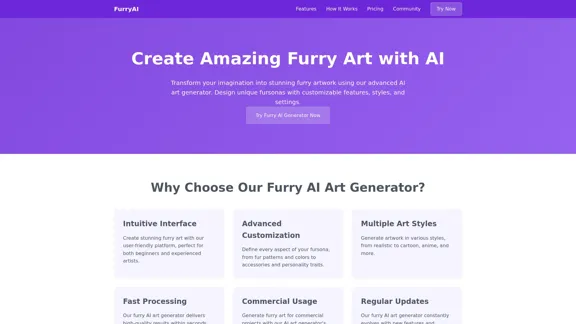
Transform your imagination into stunning furry art with our AI-powered furry art generator. Create unique fursonas with customizable features, styles, and settings.
525
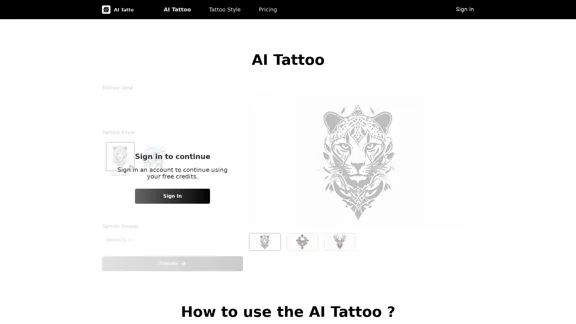
AI tattoo generator creates custom tattoo designs in seconds. Provide a detailed description of your concept, and our state-of-the-art AI will generate unique artworks specifically tailored to your needs.
112
AI Headshot Generator | Professional Headshots Created with AI
AI Headshot Generator | Professional Headshots Created with AITransform your photos into professional headshots using AI. Create stunning, business-ready portraits perfect for LinkedIn, company websites, and professional profiles.
0
Instantly Create Stunning Infographics: Convert Articles, Blog Posts, PDFs, or Text to Beautiful, Customizable Visuals in Seconds.
580
