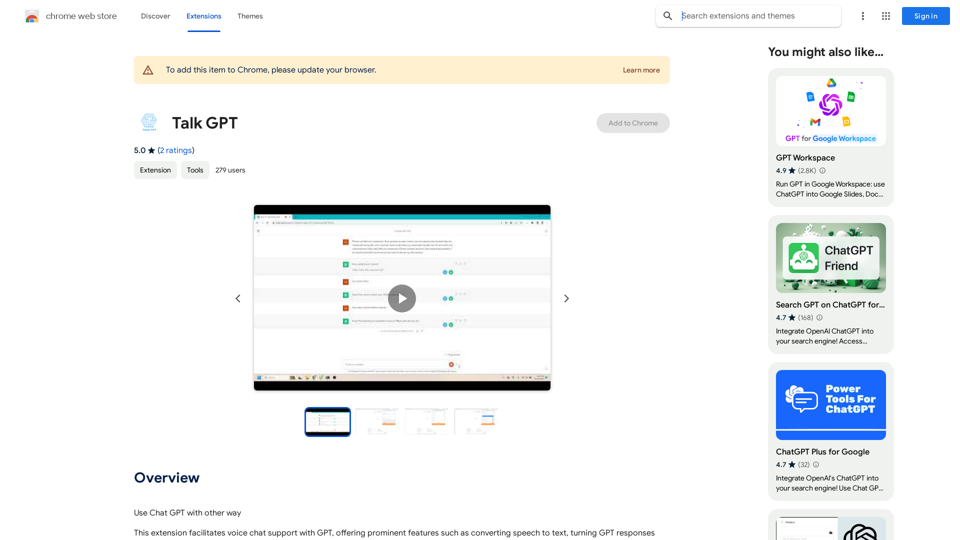
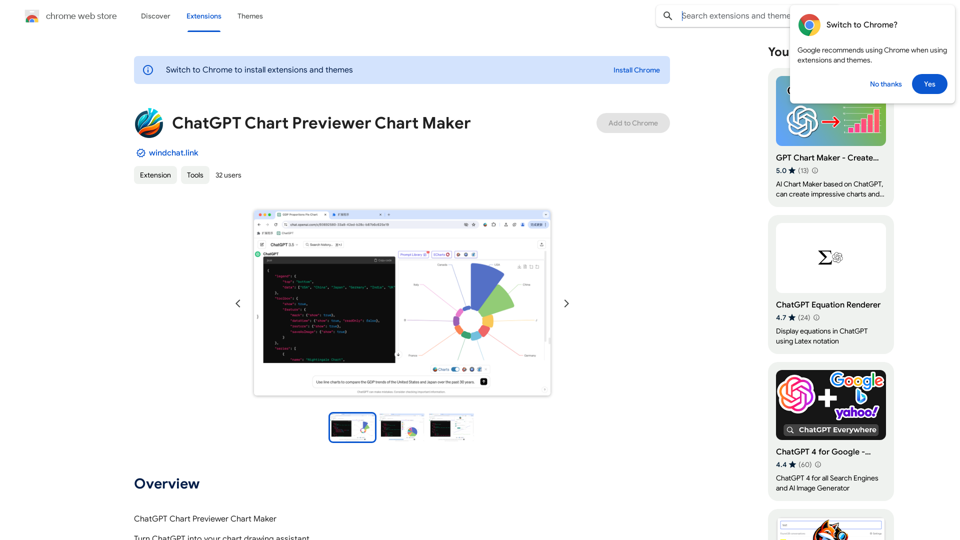
ChatGPT Chart Previewer Chart Maker est une extension qui permet aux utilisateurs de créer divers types de graphiques et de diagrammes en utilisant ChatGPT. Cet outil simplifie le processus de visualisation des données, permettant aux utilisateurs de générer de beaux graphiques de haute qualité pour une large gamme d'applications. Que vous ayez besoin de visualiser des données économiques, des statistiques de population ou des ensembles de données personnalisés, cette extension offre une solution conviviale pour créer des représentations visuelles convaincantes.
Générateur d'aperçu et de graphiques ChatGPT
Générateur de prévisualisation de graphiques ChatGPT Générateur de graphiques
Introduction
Fonctionnalité
Créer divers types de graphiques
ChatGPT Chart Previewer Chart Maker prend en charge plus de 100 types de graphiques, y compris les graphiques linéaires, les diagrammes à barres, les camemberts, et plus encore. Cette polyvalence garantit que les utilisateurs peuvent trouver la visualisation parfaite pour tout ensemble de données ou scénario d'application.
Visualisation basée sur les données
Les utilisateurs peuvent saisir leurs propres données et spécifier des exigences à ChatGPT, qui génère ensuite instantanément des graphiques visuellement attrayants. Cette fonctionnalité permet une création rapide et facile de graphiques personnalisés basés sur les informations fournies par l'utilisateur.
Récupération de données basée sur le web
En exploitant la capacité de navigation web de ChatGPT, les utilisateurs peuvent simplement formuler leur demande pour obtenir les derniers résultats de données visualisées. Cette fonctionnalité est particulièrement utile pour accéder et visualiser des informations à jour provenant de sources en ligne.
Sortie de haute qualité
L'extension permet aux utilisateurs de télécharger des graphiques sous forme d'images haute définition, les rendant adaptés à une utilisation dans des présentations, des documents, des pages web et diverses autres applications.
Options de personnalisation
Les utilisateurs peuvent expérimenter différents types de graphiques et personnaliser l'apparence de leurs visualisations pour mieux répondre à leurs besoins et préférences.
FAQ
Quels types de graphiques puis-je créer avec cette extension ?
L'extension prend en charge une grande variété de types de graphiques, y compris les graphiques linéaires, les diagrammes à barres, les camemberts, et bien d'autres. Elle couvre plus de 100 types de graphiques pour répondre à différents besoins de visualisation.
Puis-je utiliser mes propres données avec ChatGPT Chart Previewer Chart Maker ?
Oui, vous pouvez saisir vos propres données et spécifier vos exigences à ChatGPT, qui générera ensuite des visualisations basées sur votre ensemble de données personnalisé.
Est-il possible d'accéder et de visualiser les dernières données provenant de sources en ligne ?
Absolument. L'extension utilise la capacité de navigation web de ChatGPT, vous permettant de demander et de visualiser les données les plus récentes disponibles en ligne.
Comment puis-je utiliser les graphiques créés avec cette extension ?
Vous pouvez télécharger les graphiques générés sous forme d'images haute définition et les utiliser dans diverses applications telles que des présentations PowerPoint, des documents, des sites web, et plus encore.
Y a-t-il un coût associé à l'utilisation de ChatGPT Chart Previewer Chart Maker ?
Les informations de tarification pour cette extension ne sont pas spécifiées dans le contenu fourni.
Dernières informations sur le trafic
Visites mensuelles
193.90 M
Taux de rebond
56.27%
Pages par visite
2.71
Temps sur le site(s)
115.91
Classement mondial
-
Classement par pays
-
Visites récentes
Sources de trafic
- Médias sociaux:0.48%
- Références payées:0.55%
- Email:0.15%
- Références:12.81%
- Moteurs de recherche:16.21%
- Direct:69.81%
Sites web connexes

Talefy - Générateur d'histoires IA | Histoires interactives
Talefy - Générateur d'histoires IA | Histoires interactivesLibérez votre imagination avec Talefy, le générateur d'histoires alimenté par l'IA. Explorez des récits interactifs à travers divers genres, sans être limité par des choix.
209.20 K
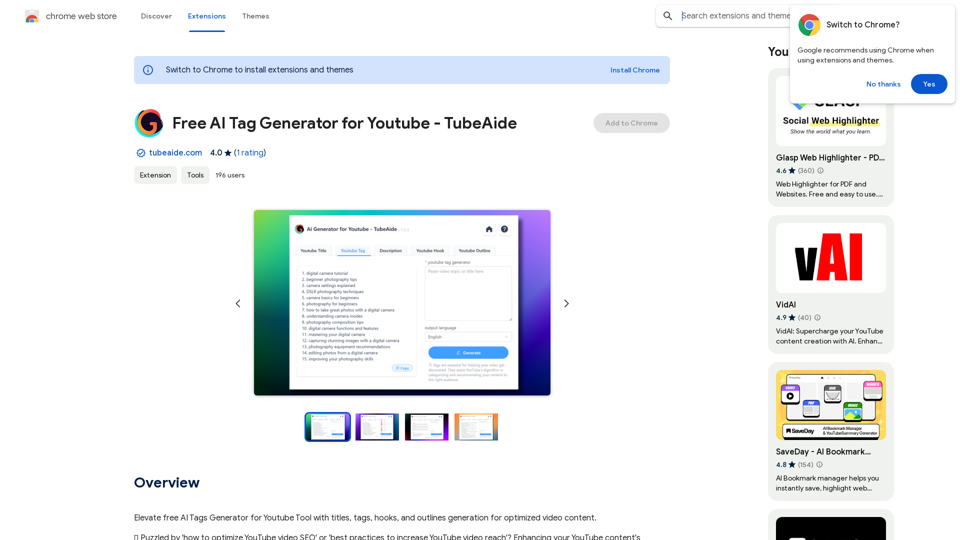
Générateur d'étiquettes AI gratuit pour YouTube - TubeAide
Générateur d'étiquettes AI gratuit pour YouTube - TubeAideÉlevez le générateur gratuit d'étiquettes AI pour YouTube avec la génération de titres, d'étiquettes, d'accroches et de plans pour un contenu vidéo optimisé.
193.90 M

Shinkai Visor : Intelligence artificielle surpuissante pour les tâches
Shinkai Visor : Intelligence artificielle surpuissante pour les tâchesShinkai donne plus de puissance à l'IA pour mieux gérer vos tâches quotidiennes et aide l'IA à se tenir au courant des informations mondiales.
193.90 M

Octoparse VOC - Analyse de recherche et d'analyse par l'IA
Octoparse VOC - Analyse de recherche et d'analyse par l'IARecherche d'extension d'avis de consommateurs par l'IA d'Octoparse.
193.90 M

Améliorez votre expérience de recherche avec l'IA, du merveilleux au savoir, à seulement un glissement de distance !
193.90 M
![Résumé d'article avec ChatGPT et prise de notes
ChatGPT peut résumer des articles et vous aider à prendre des notes.
Voici comment ça marche :
1. Copiez et collez l'article que vous souhaitez résumer dans la boîte de ChatGPT.
2. Demandez à ChatGPT de résumer l'article en utilisant un langage clair et concis.
3. Examinez le résumé généré par ChatGPT.
4. Utilisez les informations du résumé pour prendre des notes sur les points clés de l'article.
Exemple :
```
Article :
[Insérez votre article ici]
Demande à ChatGPT :
"Veuillez résumer cet article de manière concise."
Résumé généré par ChatGPT :
[Résumé de l'article]
Notes :
* [Point clé 1]
* [Point clé 2]
* [Point clé 3]
```
Résumé d'article avec ChatGPT et prise de notes
ChatGPT peut résumer des articles et vous aider à prendre des notes.
Voici comment ça marche :
1. Copiez et collez l'article que vous souhaitez résumer dans la boîte de ChatGPT.
2. Demandez à ChatGPT de résumer l'article en utilisant un langage clair et concis.
3. Examinez le résumé généré par ChatGPT.
4. Utilisez les informations du résumé pour prendre des notes sur les points clés de l'article.
Exemple :
```
Article :
[Insérez votre article ici]
Demande à ChatGPT :
"Veuillez résumer cet article de manière concise."
Résumé généré par ChatGPT :
[Résumé de l'article]
Notes :
* [Point clé 1]
* [Point clé 2]
* [Point clé 3]
```](https://static.right-ai.com/tools/2024/7/4/chromewebstore-google-com-detail-article-summary-with-chat-llkgpihjneoghmffllamjfhabmmcddfh-thumbnail-1720057844.png)
Résumé d'article avec ChatGPT et prise de notes ChatGPT peut résumer des articles et vous aider à prendre des notes. Voici comment ça marche : 1. Copiez et collez l'article que vous souhaitez résumer dans la boîte de ChatGPT. 2. Demandez à ChatGPT de résumer l'article en utilisant un langage clair et concis. 3. Examinez le résumé généré par ChatGPT. 4. Utilisez les informations du résumé pour prendre des notes sur les points clés de l'article. Exemple : ``` Article : [Insérez votre article ici] Demande à ChatGPT : "Veuillez résumer cet article de manière concise." Résumé généré par ChatGPT : [Résumé de l'article] Notes : * [Point clé 1] * [Point clé 2] * [Point clé 3] ```
Résumé d'article avec ChatGPT et prise de notes ChatGPT peut résumer des articles et vous aider à prendre des notes. Voici comment ça marche : 1. Copiez et collez l'article que vous souhaitez résumer dans la boîte de ChatGPT. 2. Demandez à ChatGPT de résumer l'article en utilisant un langage clair et concis. 3. Examinez le résumé généré par ChatGPT. 4. Utilisez les informations du résumé pour prendre des notes sur les points clés de l'article. Exemple : ``` Article : [Insérez votre article ici] Demande à ChatGPT : "Veuillez résumer cet article de manière concise." Résumé généré par ChatGPT : [Résumé de l'article] Notes : * [Point clé 1] * [Point clé 2] * [Point clé 3] ```I can do that! Please provide me with the URL of the webpage or article you'd like me to summarize. Once you give me the link, I'll analyze the text and provide you with a concise and easy-to-understand summary.
193.90 M
